Data is everywhere, but insight is rare.
That’s the biggest problem most marketers, shop owners, and SMEs face today. You log into Google Analytics, Google Ads, Facebook Ads, spreadsheets, CRM tools… and end up drowning in numbers without knowing what to act on.
This is exactly where Google Looker Studio comes in.
In this in-depth guide, we’ll break down Google Looker Studio in plain, human language. No BI jargon. No theory overload. Just clear explanations, real-world examples, and practical steps you can apply immediately—whether you’re a beginner learning digital marketing or a business owner who just wants clearer reports.

What Is Google Looker Studio?
Definition of Google Looker Studio (Simple Explanation)
Google Looker Studio is a free data visualization and reporting tool by Google that helps you turn raw data into clear, interactive dashboards and reports.
In simple terms:
- It pulls data from multiple sources (GA4, Google Ads, Sheets, Facebook Ads, etc.)
- Visualizes that data using charts, tables, and scorecards
- Helps you understand performance and make better decisions
Instead of opening 5 different tools every morning, Looker Studio lets you see everything in one single dashboard.
Real-world example:
A small eCommerce store owner can see website traffic (GA4), ad spend (Google Ads), and revenue (Sheets) on one screen—updated automatically.
Google Looker Studio vs Google Data Studio
If you’ve heard of Google Data Studio, you’re not wrong.
In 2022, Google officially rebranded Google Data Studio to Google Looker Studio as part of the broader Looker (BI) ecosystem.
What stayed the same:
- Free core features
- Drag-and-drop dashboard creation
- Google-native integrations
What improved:
- More enterprise-ready positioning
- Better integration with BigQuery & Looker
- Ongoing performance and connector improvements
If you used Data Studio before, you already know 80% of Looker Studio.
Why Marketers Care About Looker Studio
From real experience working with SMEs and marketing teams, Looker Studio solves three painful problems:
- Reporting takes too much time
- Data is scattered across platforms
- Stakeholders don’t understand raw numbers
With Looker Studio, marketers can:
- Automate weekly/monthly reports
- Create client-ready dashboards
- Focus on insights instead of screenshots
How Google Looker Studio Works (Concept Made Simple)
Data Sources → Dashboard → Insights
At its core, Looker Studio follows a very simple flow:
- Connect data sources (GA4, Ads, Sheets, etc.)
- Visualize the data (charts, tables, scorecards)
- Analyze and act on insights
Example:
You connect Google Ads + GA4 → see cost vs conversions → realize one campaign burns budget → pause it.
No exporting. No copy-paste. No manual work.
Looker Studio Architecture Overview
You don’t need to be technical, but understanding the structure helps:
- Connectors: bring data into Looker Studio
- Data model: metrics, dimensions, calculated fields
- Visualization layer: charts, filters, layouts

According to Google, Looker Studio supports hundreds of connectors, both free and paid, making it flexible for most marketing stacks.
Key Features of Google Looker Studio
Data Connectors (Free & Paid)
Looker Studio connects directly to popular marketing platforms:
- Google Analytics 4 (GA4)
- Google Ads
- Google Search Console
- Google Sheets
- YouTube Analytics
For non-Google tools (Facebook Ads, TikTok Ads, CRM), you can use third-party connectors like Supermetrics or Porter Metrics.
Expert insight:
According to Google Cloud documentation, using native connectors ensures better performance and data freshness.
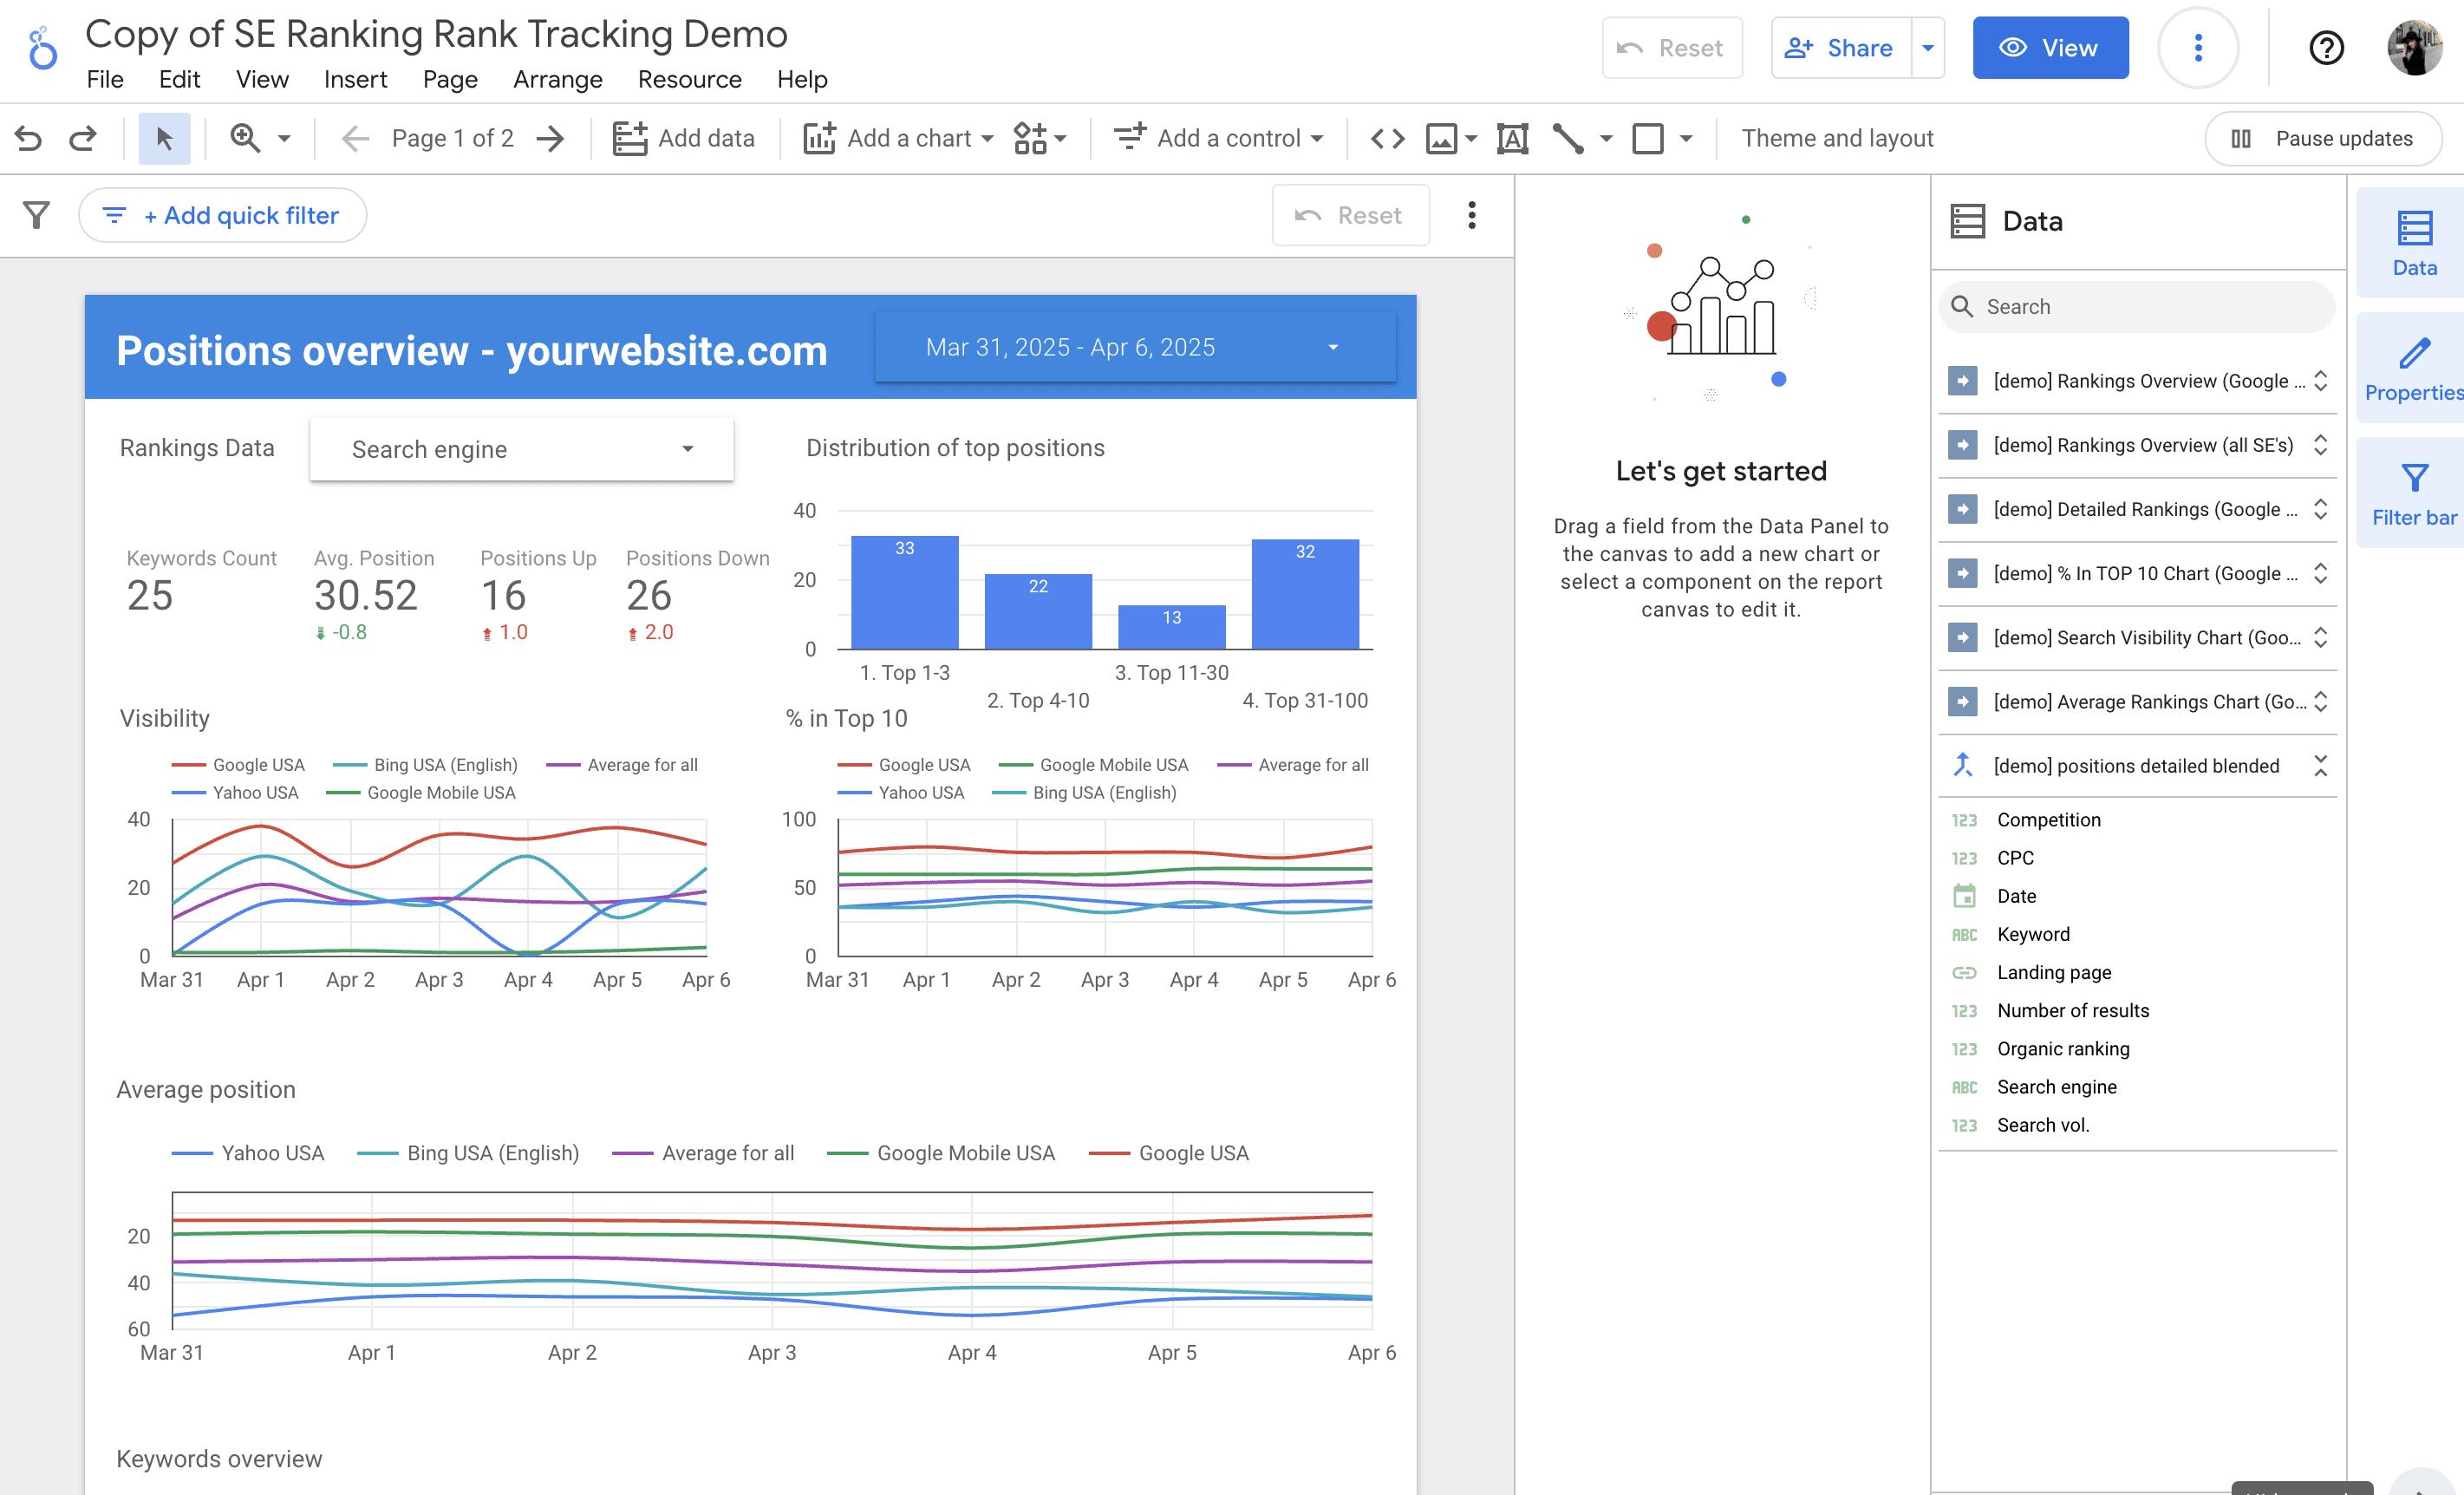
Dashboard & Visualization Options
Looker Studio offers:
- Scorecards (KPIs)
- Time-series charts
- Bar & pie charts
- Tables with sorting & filters
The real value is interactivity: users can change date ranges, filter channels, or drill down—without touching the data source.
Real-Time & Scheduled Reporting
Depending on the data source:
- Some data updates near real-time
- Others refresh on a schedule
You can also schedule reports to be emailed automatically—perfect for clients or management.
Collaboration & Sharing
Similar to Google Docs, Looker Studio allows:
- View-only access
- Edit access
- Share via link
This makes it ideal for agencies managing multiple clients.
Common Looker Studio Use Cases (Marketing Focus)
SEO Dashboard
An SEO dashboard typically includes:
- Organic sessions
- Top landing pages
- Search queries
- Conversions from organic traffic
This pairs perfectly with GA4 and Search Console. You can explore more SEO fundamentals in our internal guide:
Digital Marketing Strategy from A–Z.
Google Ads & Paid Media Dashboard
Key metrics usually tracked:
- Spend
- Clicks & CPC
- Conversions
- ROAS

According to Think with Google, marketers who review performance dashboards weekly are significantly faster at optimization decisions.
eCommerce Performance Dashboard
For shop owners, Looker Studio can answer one key question:
“Where is my money really coming from?”
- Revenue by channel
- Top products
- Conversion rate
Frequently Asked Questions (FAQ)
Is Google Looker Studio free?
Yes. The core version is completely free. Costs only apply if you use paid third-party connectors.
Do I need coding skills to use Looker Studio?
No. Most reports can be built using drag-and-drop. Advanced users may use calculated fields, but coding is optional.
Is Looker Studio suitable for beginners?
Absolutely. In fact, it’s one of the easiest reporting tools for beginners once the basics are understood.
Key Takeaways So Far
- Google Looker Studio helps centralize and visualize marketing data
- It replaces manual reporting with automated dashboards
- Marketers, SMEs, and agencies benefit the most
In the next part of this guide, we’ll walk through step-by-step how to build your first Looker Studio report, compare it with other tools, and share best practices from real projects.
Step-by-Step: How to Create Your First Google Looker Studio Report
Many beginners think Google Looker Studio is “complicated” simply because they’ve never seen the process broken down clearly. In reality, creating your first report is much easier than it looks.
Below is the exact workflow we’ve used in real projects for SMEs and marketing teams.
Step 1 – Create a New Report
Go to Looker Studio and click “Create” → “Report”.
You’ll see a blank canvas. Don’t panic—this is where everything starts.
Practical tip: Before adding anything, ask yourself one question:
“What decision should this report help me make?”
This mindset prevents vanity dashboards filled with useless metrics.
Step 2 – Connect Your Data Source
Choose a data source such as:
- Google Analytics 4 (for traffic & behavior)
- Google Ads (for paid performance)
- Google Sheets (for revenue or manual data)
Authorize access once, and Looker Studio will reuse it later.
Real-world example:
A local service business connects GA4 + Google Ads to understand which keywords generate phone calls, not just clicks.
Step 3 – Build Your First Dashboard
Start simple:
- Add a scorecard for key KPIs (sessions, conversions, revenue)
- Add a time-series chart to see trends
- Add a table for breakdowns (channel, page, campaign)
Resist the urge to add “everything.” Clear beats complex.
Step 4 – Share & Automate Reports
Once finished, you can:
- Share a live link (clients always see updated data)
- Schedule email delivery (weekly or monthly)
This alone can save marketers hours of reporting time every month.

Best Looker Studio Dashboards for Digital Marketing
SEO Dashboard Template
An effective SEO dashboard focuses on outcomes, not noise.
Recommended metrics:
- Organic sessions
- Top landing pages
- Search queries (from Search Console)
- Conversions from organic traffic
Common mistake: Tracking rankings without linking them to traffic or leads.
You can deepen SEO fundamentals in our guide:
A/B Testing for Conversion Optimization.
Ads Performance Dashboard Template
Paid media dashboards should answer one question fast:
“Am I making or losing money?”
| Metric | Why It Matters |
|---|---|
| Spend | Cost control |
| Conversions | Actual results |
| CPA / ROAS | Profitability |
All-in-One Marketing Dashboard
This dashboard combines:
- SEO
- Paid Ads
- Email or CRM data
It’s ideal for founders and managers who want a big-picture view without logging into multiple tools.
Looker Studio vs Other Reporting Tools
Looker Studio vs Google Analytics
These tools are often confused, but they serve different purposes.
| Tool | Main Role |
|---|---|
| Google Analytics | Data collection & analysis |
| Looker Studio | Reporting & visualization |
In practice, they work best together.
Looker Studio vs Excel / Google Sheets
Sheets are great for raw data. Looker Studio is better for:
- Automation
- Visualization
- Sharing live reports
Looker Studio vs BI Tools (Power BI, Tableau)
Enterprise BI tools are powerful—but often overkill for SMEs.
According to Gartner, ease of use is one of the top adoption barriers for BI tools. This is where Looker Studio shines.
Common Mistakes Beginners Make with Google Looker Studio
Tracking Too Many Metrics
More data does not mean more insight.
If a metric doesn’t support a decision, remove it.
Wrong Data Blending
Blending mismatched data sources can lead to misleading numbers.
Rule of thumb: If you don’t understand how data is joined, don’t blend it yet.
Ignoring Report Design
Good design improves understanding.
- Use consistent colors
- Group related metrics
- Guide the reader’s eye
Best Practices for Using Looker Studio Effectively
KPI-First Dashboard Design
Always define KPIs before opening Looker Studio.
Ask:
- What does success look like?
- How often will this be reviewed?
Naming Conventions & Structure
Clear naming helps when dashboards scale:
- Use consistent metric names
- Label charts clearly
Performance Optimization Tips
To keep reports fast:
- Limit unnecessary charts
- Avoid heavy blends
- Use date filters wisely
Frequently Asked Questions (FAQ)
Can Google Looker Studio replace Google Analytics?
No. Looker Studio visualizes data; Google Analytics collects and analyzes it.
Is Looker Studio good for SEO reporting?
Yes. Especially when combined with GA4 and Search Console.
Can I share reports with clients?
Yes. You can share live links or schedule automated emails.
Final Thoughts: Should You Use Google Looker Studio?
From hands-on experience, Google Looker Studio is one of the best free reporting tools available for marketers and small businesses.
Use it if you want to:
- Save time on reporting
- See all marketing data in one place
- Make clearer, faster decisions
For most SMEs, Looker Studio is not just “enough”—it’s a competitive advantage.
If you want to strengthen your overall marketing foundation, explore related guides on DigitalMarketingCF:
Author note:
This article is written by the DigitalMarketingCF editorial team, based on real-world implementation experience across SEO, paid ads, and analytics projects for SMEs and marketing teams.